One Extraction Score Hid a Regression
August 29, 2026
The first result looked decisive:
| Extractor | Precision | Recall | F1 |
|---|---|---|---|
| plain text stripping | 0.659 | 0.957 | 0.746 |
| three filters | 0.723 | 0.909 | 0.774 |
The scorer computes precision, recall, and F1 for each page, then averages each metric separately across the split. The filtered extractor’s mean precision rose by 0.064: a larger fraction of the words it returned belonged in the reference text. Its mean recall fell by 0.048: it also discarded more words that the reference kept. On one page, precision and recall combine as
The table’s F1 values are the separate means of those per-page results, not the harmonic means of the two displayed aggregate columns. Their difference is 0.028.
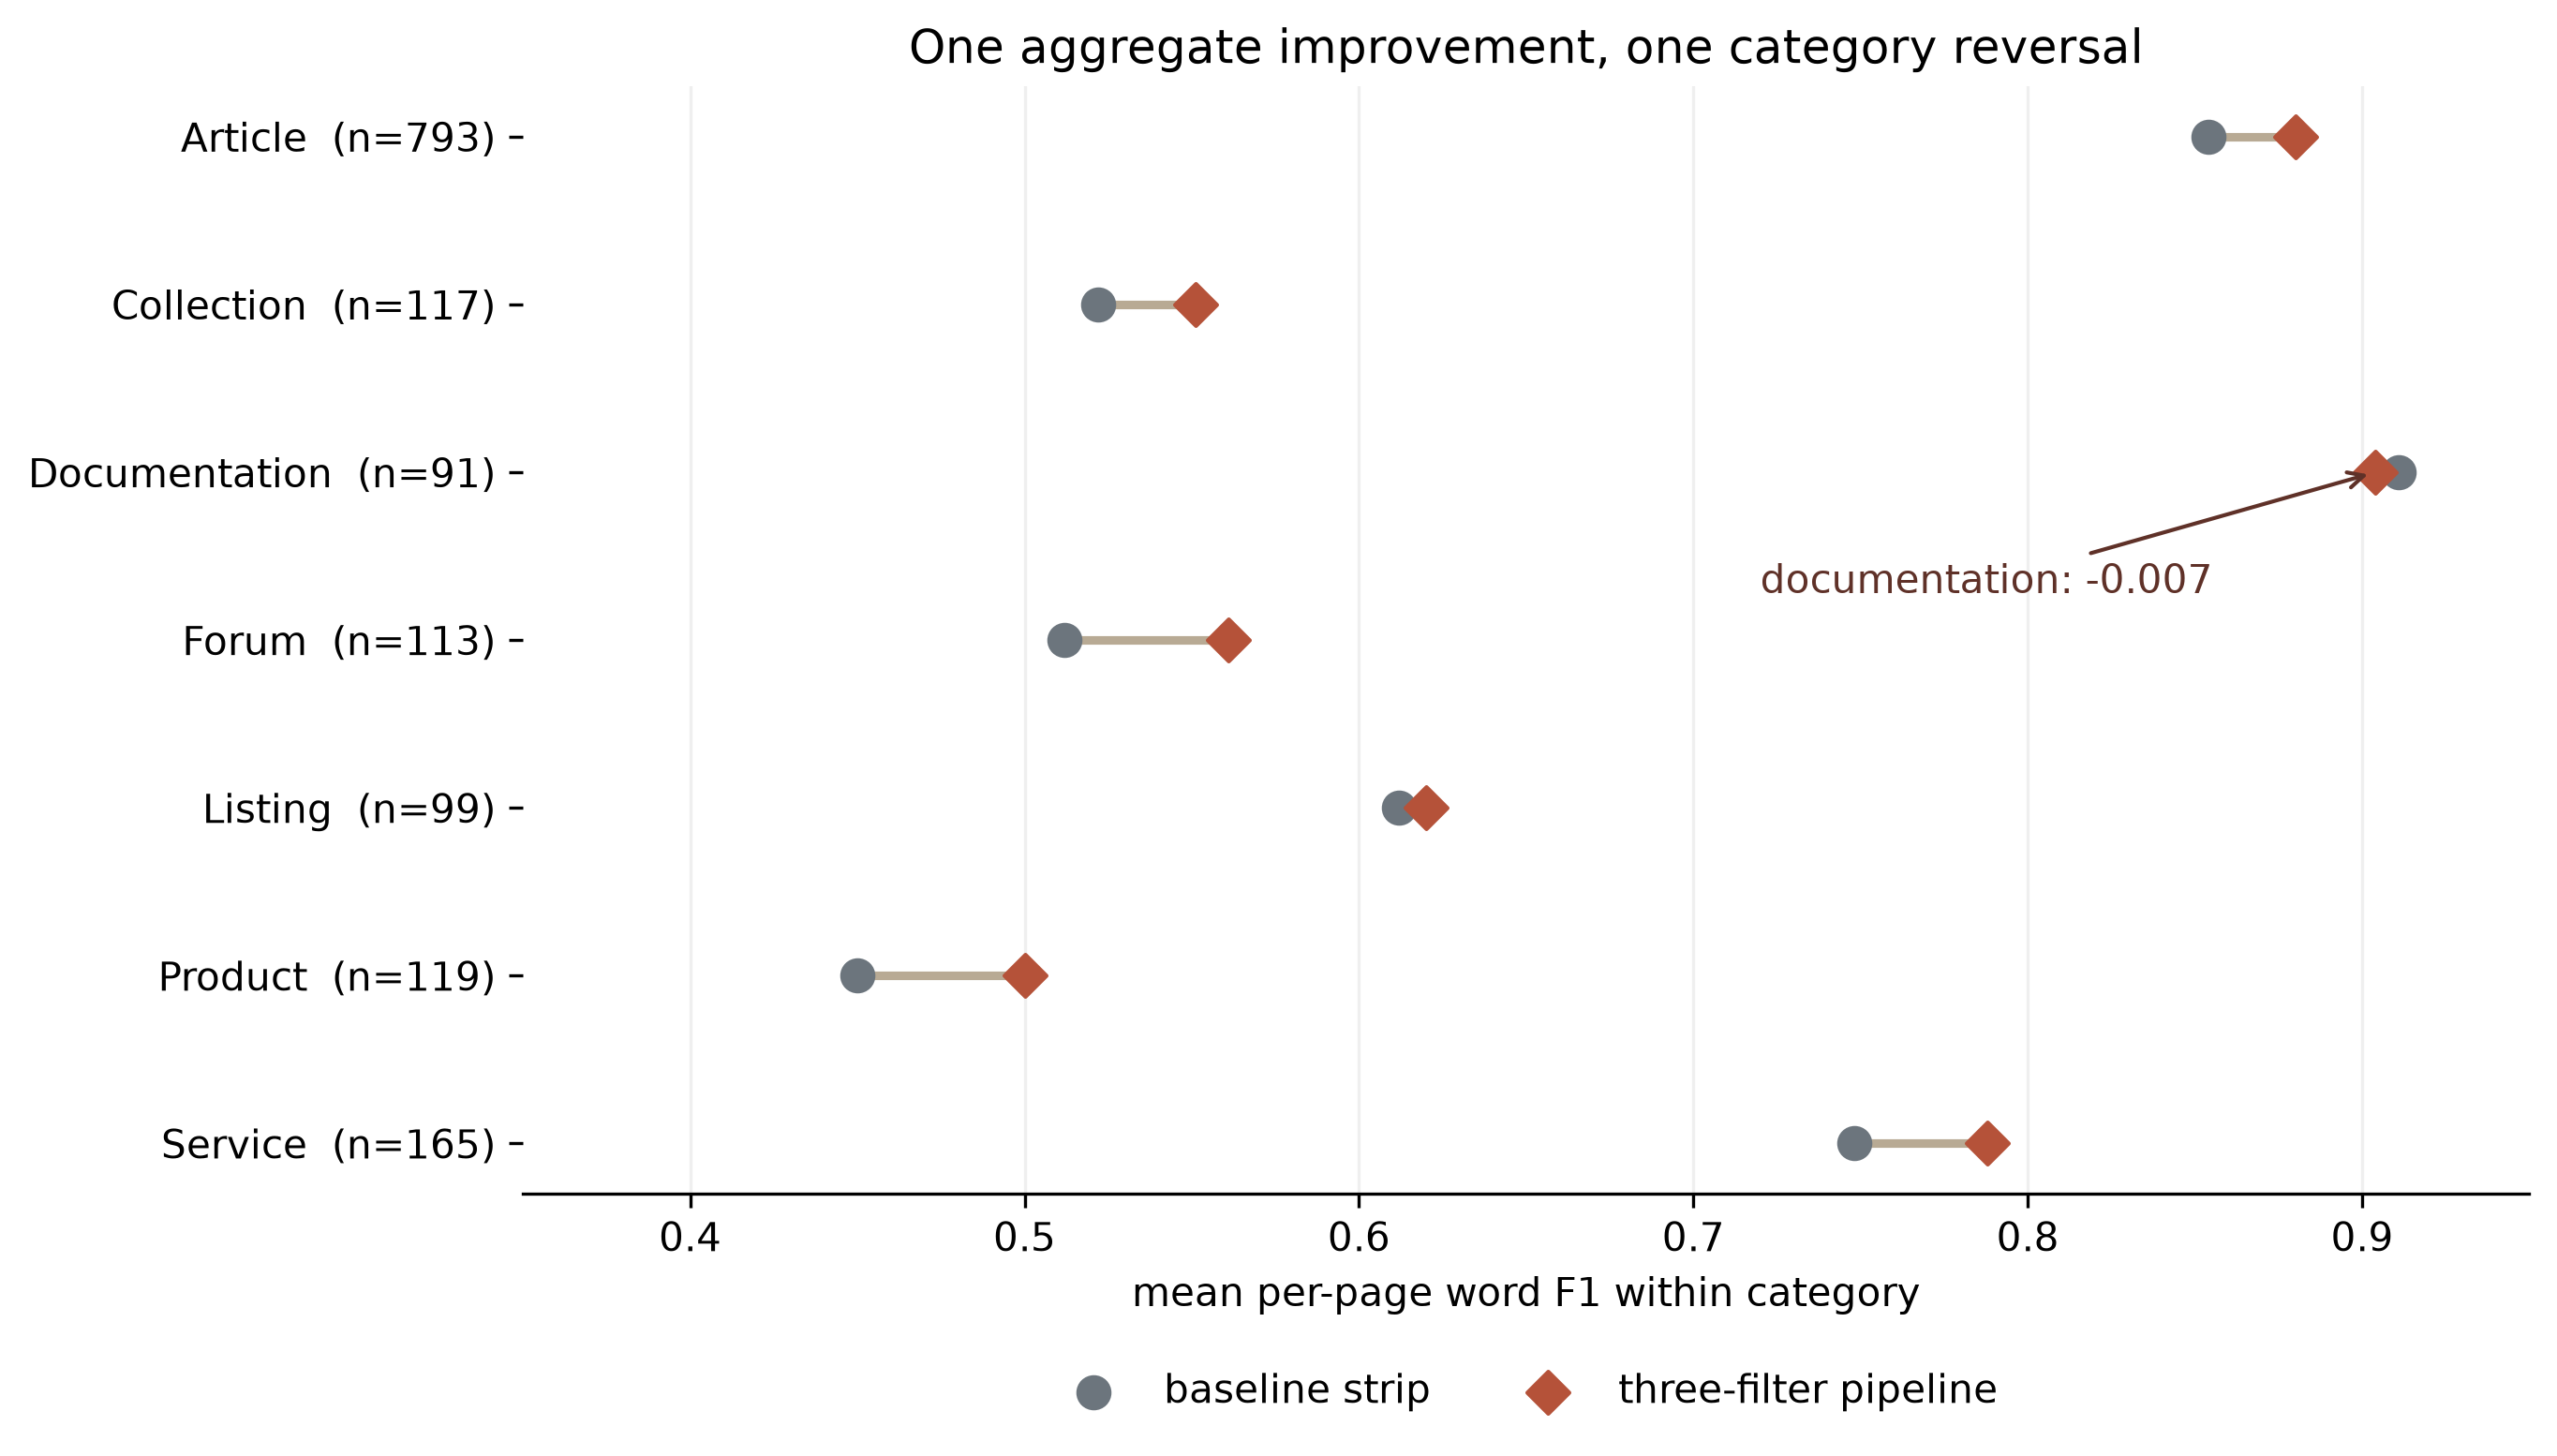
Then I split the result by page type. Documentation went backward.
# What the score counts
The Web Content Extraction Benchmark (WCXB) pairs web pages with reviewed main-content text. Its development split contains 1,497 pages across seven types: articles, documentation, services, listings, collections, forums, and products. Articles account for 793 pages, or 53% of the split.1
For each page, the scorer lowercases the predicted and reference text, breaks both into word tokens, and counts their overlap. Repeated words count repeatedly. If the extractor returns 90 reference words plus 10 unwanted words from navigation, its precision is . If the reference contains 120 words, its recall is . The page’s F1 is about 0.818.
The reported score takes the mean of the page scores, rather than first joining every page
into one large document. The per-type rows average only the pages of that type;
the ALL row averages all 1,497 pages. This makes every page equal within the
aggregate, but not every category: the article category receives more than
eight times the weight of documentation because it contains more than eight
times as many pages.
WCXB’s reference text was drafted with LLM assistance and then passed through four human review rounds plus automated checks.2 That makes it a carefully reviewed target, not an oracle for every downstream use. Word overlap also ignores word order, document structure, and whether an extractor preserved a table or code block as a coherent object.
# The pipeline
The baseline strip_to_text scans the HTML, strips tags, removes semantic furniture such as nav, footer, and aside elements, decodes entities, and collapses whitespace. On this benchmark it has higher recall and lower precision than either filtered pipeline.
The experimental pipeline passes the extracted segments through three filters:
- remove segments whose text is dominated by links;
- remove segments with too little sentence-like text;
- remove short label-like or non-sentence fragments.
Each stage tries to raise precision by recognizing a different shape of page furniture. Each can also mistake real content for furniture. A documentation sidebar may be link-heavy but meaningful. A longer prose-classified API index may contain too little sentence-like text. A compact parameter description may look like the label-like fragment the last filter was designed to remove.
That failure mode is not visible in the aggregate row.
# The category reversal
Reproduce this figure
The documentation decline is small, 0.007 F1, but it reverses the direction of the headline. It also occurs in the category where the baseline is strongest. The filtered pipeline improves product pages from 0.450 to 0.500 and forum pages from 0.512 to 0.561, yet turns 0.911 into 0.904 for documentation.
The aggregate is not wrong. It answers its stated question: what is the mean per-page score over this particular 1,497-page mixture? It does not answer a different question: will the change improve a corpus made mostly of software documentation?
This distinction matters before any sophisticated statistics enter. If the deployment mixture differs from the benchmark mixture, the aggregate applies the wrong weights. If one category has a minimum acceptable quality, an average allows gains elsewhere to compensate for violating it.
# Removing one filter changes the winner
The benchmark runner also contains a useful ablation called both. It applies
the link-density and boilerplate filters but omits the sentence-density filter.
It is an experimental runner variant, not a released recommendation.
| Pipeline | Precision | Recall | F1 | Documentation F1 |
|---|---|---|---|---|
| three filters | 0.723 | 0.909 | 0.774 | 0.904 |
| link + boilerplate | 0.717 | 0.920 | 0.775 | 0.913 |
Removing one filter recovers 0.011 recall, gives back 0.006 precision, and nudges the aggregate above the full pipeline. Documentation rises above both the three-filter result and the 0.911 baseline.
This does not prove that sentence density alone caused every changed page. The filters run in sequence, so removing the middle stage also changes what reaches the last stage. It does show that the full pipeline’s aggregate gain is not a monotone story in which every added heuristic helps. The ablation changes both the tradeoff and which pipeline wins.
The choice among these rows therefore belongs to the application. A search index that suffers badly from navigation text may prefer precision. An archive that cannot recover discarded prose may put a higher price on recall. A documentation corpus may reject the three-filter pipeline even when its mixed benchmark F1 is higher than the baseline.
# What this result does not establish
These measurements use the public development split. I inspected and compared variants on that split; I did not run the benchmark’s held-out test set. Consequently, the 0.001 difference between the two filtered variants is an observation about these 1,497 pages, not evidence that one will generalize better.
The comparison also has no uncertainty interval. The useful signal here is not that 0.775 is definitively greater than 0.774. It is that a plausible aggregate summary hides a category moving in the opposite direction, while a component ablation changes the precision/recall balance. Those facts are visible without promoting a one-thousandth difference into a product decision.
deformat keeps a tiny committed regression corpus for fast CI. Those fixtures
can prevent a known scanner or filter failure from returning. They cannot stand
in for a representative benchmark: a handful of authored cases answers
“did this exact behavior regress?”, while WCXB asks how an extractor behaves
across a much broader page collection.
The durable report is therefore not one bold score. It is:
- the aggregate precision, recall, and F1;
- the same metrics by page type, with category counts;
- ablations that identify which heuristic changes the tradeoff;
- an explicit statement of the evaluated split and the target deployment mix.
One number is convenient for sorting experiments. The breakdown is what makes the result usable.
Reproduce the WCXB development results and figure
recorded results figure generator lockfile uv run --locked gen_category_f1.py
The result packet records the pinned dataset revision, exact deformat commit, and the three benchmark commands. The runner and scorer are available in the matching source tree.
# References
[1] Murrough Foley, Web Content Extraction Benchmark, dataset card and development-split distribution, CC-BY-4.0. Hugging Face ↩
[2] Murrough Foley, Web Content Extraction Benchmark, annotation process and quality controls. Dataset repository ↩